XRP Price Analysis: Bullish flag pattern emerges, XRP aims to break $2.15

XRP is trading between $2.12 and $2.13 with a market cap of $123.66 billion and a 24-hour trading volume of $2.06 billion. The price is fluctuating in a tight range of $2.05 to $2.14, suggesting potential volatility is brewing.
XRP
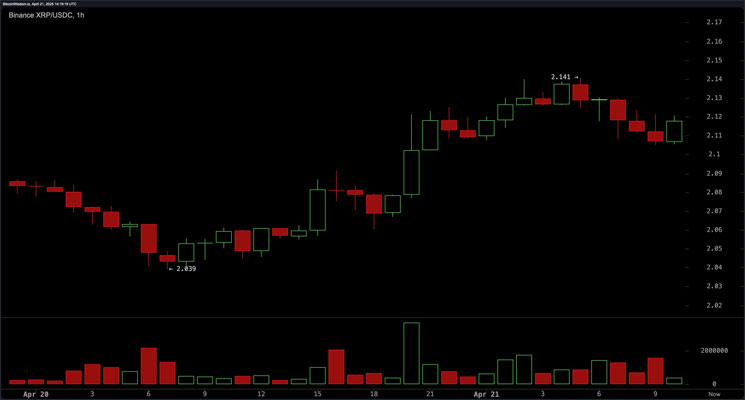
On the 1-hour chart, XRP's short-term technical setup shows a bullish trend, having climbed steadily from $2.03 to $2.14 since April 20. The pattern currently forming suggests a bullish flag, which generally indicates that price action is likely to continue, assuming volume moves in line with the trend. Price action is consolidating above the $2.11 level, which has shown resilience during minor pullbacks. Confirmation of support at $2.10 or a clear breakout above $2.14 would strengthen the bullish thesis. For traders managing risk, a stop loss set below $2.08 appears prudent, while exit targets are between $2.20 and $2.25.
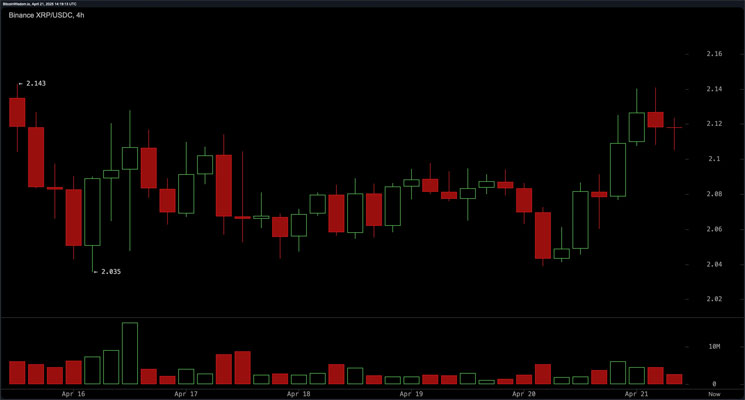
On the 4-hour chart, XRP continues to consolidate in a wide range between $2.03 and $2.14, supported by the formation of higher lows – an early indicator of accumulation. The slight upside bias on this timeframe is reinforced by the increasing volume on the green candle, pointing to a potential bullish divergence. The recent test of the $2.14 lead suggests that market appetite is building, but a clear breakout is still pending. Once the asset breaks out and retests the upper limit, especially with strong volume support, a move towards $2.20–$2.25 is likely.
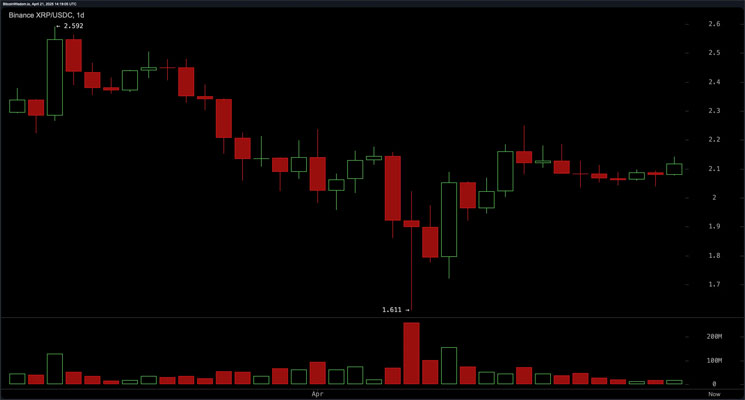
The daily chart provides a broader perspective on the market’s recovery from the recent downtrend, with the market rebounding from a notable low of $1.61 after a prolonged bearish phase. XRP is currently trading in a range of $2.10 to $2.12, suggesting that the market is pausing and may be preparing for the next directional move. Support at $1.61 remains structurally important, while resistance lies in the $2.20–$2.30 range. Price action suggests an accumulation phase, which could set the stage for a more sustained up move if resistance at $2.20 is breached on strong volume.
Among the oscillators, the RSI is at 49.84136, the Stochastics at 74.60660, the CCI at 59.93883, the ADX at 20.39190, and the Striking Oscillator at -0.08080, all reflecting neutral sentiment. Momentum shows a slight negative bias at 0.09519, while the Moving Average Convergence Divergence (MACD) level flashes a bullish signal at -0.03369, highlighting the market’s indecision, with a possible direction once confirmation arrives.
Moving averages provide a nuanced picture: the 10-period exponential moving average (EMA) at $2.08240 and simple moving average (SMA) at $2.09834 show positivity, as do the 20-period EMA and SMA. However, the 30-, 50-, and 100-period EMAs and SMAs are all showing bearish signals, suggesting a negative drag in the medium term. Notably, the 200-period EMA and SMA, at $1.96321 and $1.94896, respectively, are both showing bullishness – meaning that long-term trend momentum remains constructive despite short-term volatility. This hierarchical divergence across time frames underscores the importance of volume as the next driver of directional clarity.
Bullish conclusion:
If XRP holds above $2.10 support and breaks above $2.14 with sufficient confidence and volume, the bullish flag pattern on the 1-hour chart and the ascending structure on the 4-hour chart may confirm a push to $2.20–$2.30. The buy signal from the long-term moving averages is reinforcing, and the continued uptrend remains as shown, especially with continued accumulation and improved market sentiment.
Bearish conclusion:
Failure to hold the $2.10–$2.11 support zone may undermine the short-term bullish setup, opening the possibility of retesting lower supports near $2.05 or even $2.00. With the medium-term moving averages still tilted bearishly and the oscillators generally neutral, XRP may slide into a correction phase if the current levels fail to spark buying momentum.